Each metal alloy has its own phase diagram. As previously said, heat treatment is done according to these diagrams. They show the structural changes that take place at different temperatures and different chemical compositions.
Let’s use the iron-carbon phase diagram as an example, as this is the most known and widely taught one at universities.
iron carbon phase diagram
The iron-carbon phase diagram is an important tool when learning about the behaviour of different carbon steels when subjected to heat treatment. The x-axis shows the carbon content in the alloy and the y-axis shows the temperature.
Note that 2.14% of carbon is the limit where steel becomes cast iron,
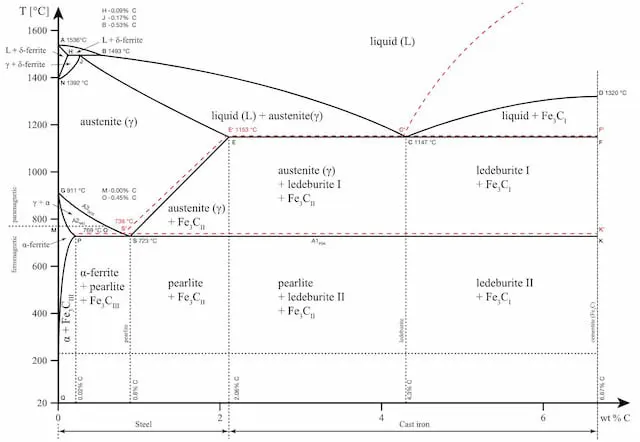
The diagram displays various regions where the metal exists in different microstates such as austenite, cementite, pearlite. These regions are marked by boundaries A1, A2, A3, and Acm. At these interfaces, phase changes occur when the temperature or carbon content value passes through them.
A1: The upper limit of the cementite/ferrite phase.
A2: The limit where iron loses its magnetism. The temperature at which a metal loses its magnetism is also called Curie temperature.
A3: The interface that separates Austenite + Ferrite phase from the γ (Gamma) austenite phase.
Acm: The interface that separates γ Austenite from the Austenite + Cementite field.
The phase diagram is an important tool to consider whether heat treatment will be beneficial or not. Each structure brings along certain qualities to the final product and the choice of heat treatment is made based on that.